People analytics – often called HR analytics or workforce analytics in practice – is a science that uses your employee data to measure and predict the ROI of your hiring, engagement and retention strategies.
In other words, people analytics removes guessing and ‘gut feeling’ from your HR management. It makes HR data-driven just like sales or marketing and helps you make sense of your employee data. It’s much more than simple reporting: it’s analyzing the trends to answer questions critical to your business.
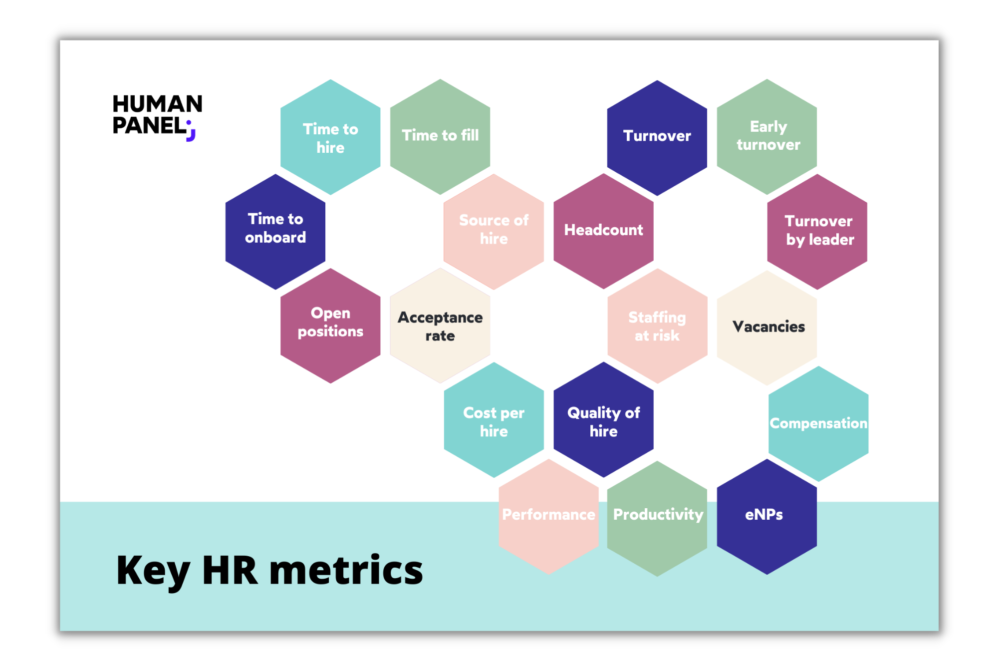
People analytics uses so called HR metrics to to show you the evidence of what is going on in your organization. HR metrics are used to determine the effectiveness and ROI of all investments and initiatives you make in HR.
They provide answers to questions like:
Hiring
How many employees are hired and onboarded?
How long it takes?
How much it costs?
How effective your recruitment funnel is?
At which stage candidates reject your offer?
Turnover
How many employees leave the company?
What age are they?
What teams they belong to?
Who’s their leader?
How much do they earn?
When was the last time they got promoted?
How much the turnover costs your company?
Planning
How long it takes to fill a vacancy?
How many open positions you have?
What is the cost of recruitment in a specific team or department?
How people analytics helps business?
HR has long been considered a “soft” business area based on “gut feeling”. It often happens not because HR leaders don’t want to back up their findings with data, but because they lack the essential metrics.
If they had access to reliable data they could finally have measurable KPIs and finally build a strategic vision instead of spending time on operational tasks.
To be an equal business partner in board meetings, HR leaders need to present some numbers, and talk about specific metrics, values, and quantitative insights.
Human capital is something extraordinary in today’s job market. It is what can help outperform the competition. This is why HR analytics is no longer at the bottom of the list of organizational needs. The demand for reports is high, and measuring HR and its impact on an organization is critical. Every CEO knows that people are the pillar of the organization.
But many CEOs have one problem with the employee data.
It is scattered across various systems which make it difficult to identify troubles and alarming trends early. Also, the lack of correlation between different data points means HR teams can’t forecast the ROI of their investments. It’s hard to see the measurable business outcomes that come from HR initiatives.
Imagine you have a problem with high people turnover. You know the turnover rate but how do you know what causes it if your data is not integrated? To address the problem and implement an effective retention strategy, you need to know how turnover is related to employees’ compensation, time since last promotion, pay increases, performance, leaders and other factors, such as demographic data.
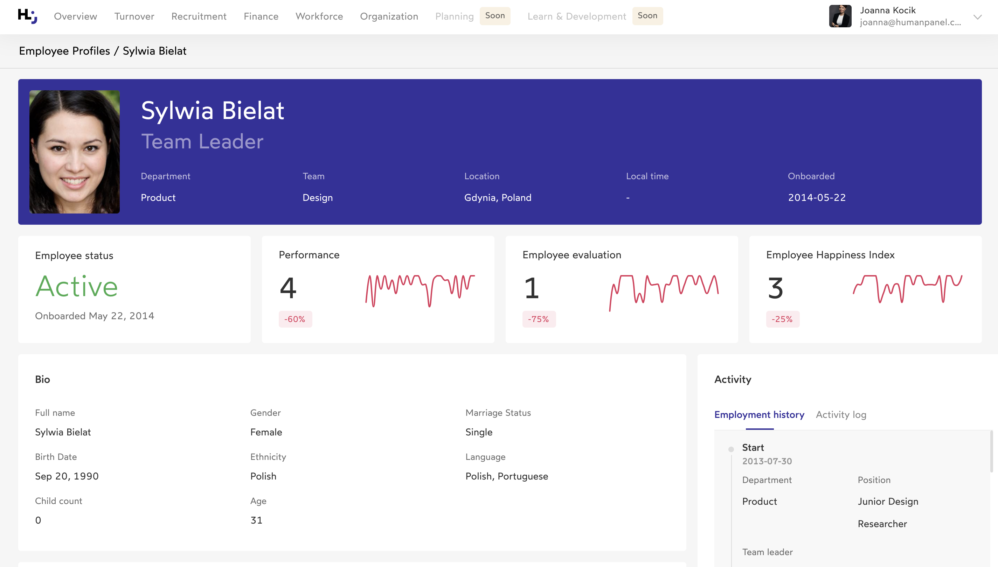
Employee profile example in Human Panel Platform
Without this data, you are not able to determine the reasons. You are literally blind – and you can’t address the problem you are trying to solve.
This is what happened to Kuba Filipowski, Chief Strategy Officer at Netguru. Eventually, the problem was solved thanks to HR analytics. You can read how they did it here.
People analytics shows you those correlations between various data points. It brings your employee data together at one, easy-to-navigate platform. If you’re interested how it works, book a demo of Human Panel using the form below. If you want to explore Human Panel features yourself, continue reading past the form.
The number of job openings in your company, expressed as a percentage of job openings compared to the total number of jobs in a particular department or in the company as a whole.
A high percentage of open positions may indicate high demand or low market supply. Human Panel people analytics platform allows you to filter which department is the most understaffed or growing the fastest. Seeing how many junior and senior positions you are looking to fill can also help you better plan your hiring process.
Applications per opening
The number of applications per job vacancy.
The number of applicants per job opening gives an indication of the popularity of the job. A very large number of applicants can indicate two things: either a high demand for jobs or a job description that is too broad.
The number of applications per job opening is not an indicator of the number of suitable candidates. This is measured by another metric – candidates per hire, which we explain below.
Application completion rate
The ratio of applications submitted to the total number of applications started.
The application completion rate measures the success of the recruitment system. It may be of particular interest if your company uses a dedicated online recruiting platform that requires candidates to enter their information and CV. If your application completion rate is low, it may mean that candidates are not getting on with the system and are dropping out. The reasons could be a non-user-friendly interface, poorly organized questions, inappropriate questions, technical issues, etc.
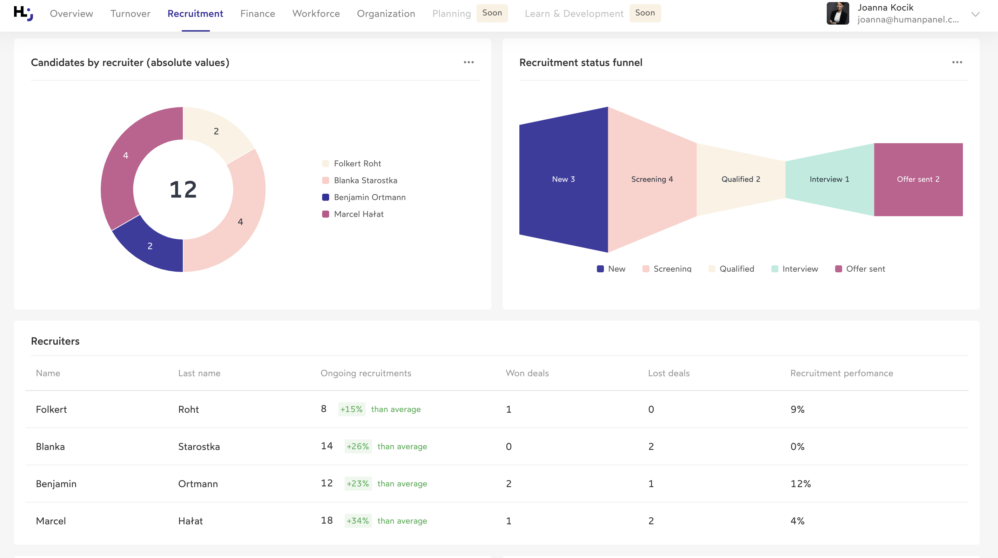
Human Panel Recruitment Dashboard
Candidates per hire by department and status
The number of candidates interviewed before one is hired.
Candidates per hire measures the effectiveness of your recruiting methods. Some companies set a goal of 3-5 interviews per open position to save the hiring manager’s time and resources.
With Human Panel, you can filter how many candidates are in your pipeline for a given position by department and stage of the funnel. You also have access to all candidate profiles.
Offer acceptance rate
The percentage of candidates who accepted a formal job offer.
The offer acceptance rate tells you how attractive your final offer is to a candidate. A low acceptance rate may indicate compensation problems or a poor interview.
The goal of most companies is to have a high acceptance rate of offers. A rate of over 90% shows that there is a good match between the company’s requirements and the expectations of the selected candidates.
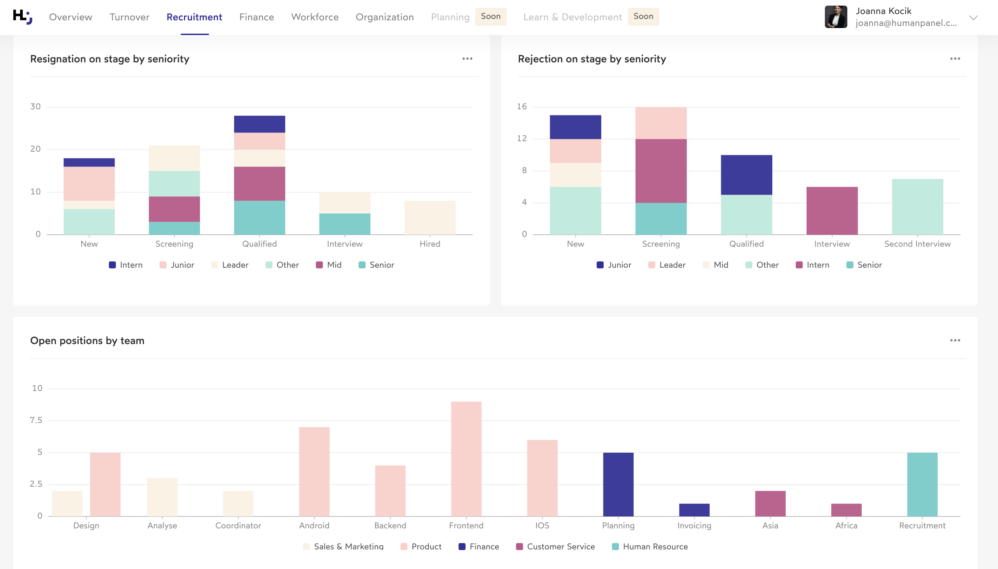
The number of candidates who are rejected at each stage of the recruitment process and how many resign on their own.
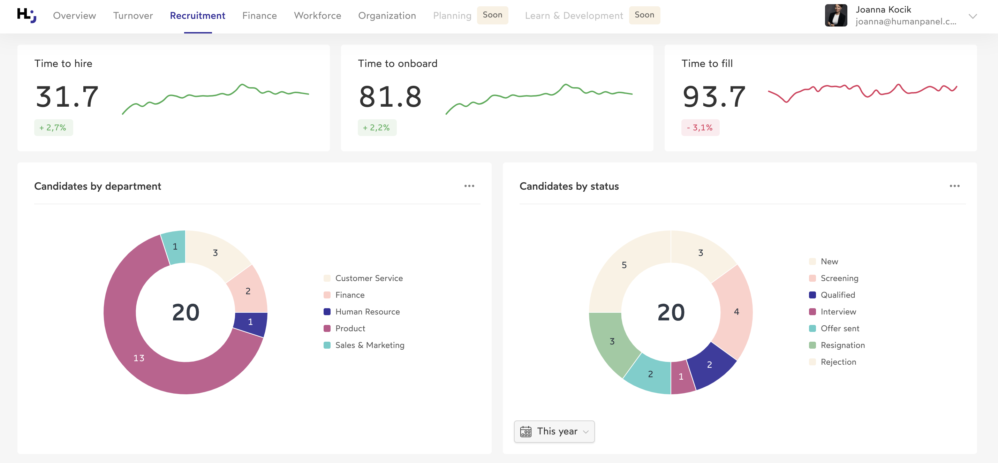
Human Panel Platform Recruitment Dashboard
Time to hire
The number of days between the time you contact a candidate and the time a candidate accepts your offer.
This HR metric shows you how much time you spend recruiting and how quickly you can select the right candidate once you have multiple candidates in your pipeline. It can also show you how efficient your recruitment process is.
Time to fill
The number of days between the time you post (or receive approval for) a job posting and the time a candidate accepts your offer.
This metric is mainly used for business planning and shows what the supply/demand ratio is for certain jobs. It also shows how long your overall hiring process takes.
The number of days between the candidate’s acceptance of your offer and the time a new employee begins to make a meaningful contribution.
In today’s market, attracting and retaining talent is extremely difficult. The onboarding process can make the difference between a new employee’s success or failure. A study by Gallup shows that companies with a good onboarding process increase new employee retention by 82% and productivity by over 70%. Effective onboarding also reduces mistakes and increases employee retention.
Cost per hire is the average amount of money you spend to hire an employee. In other words, it is used to measure how much it costs you to fill a job opening.
To calculate the cost per hire, you should add up all your expenses – both internal and external. Then divide that total by the number of hires in a given period. This metric can be customized with Human Panel people analytics platform.
Source of hire
Hiring source indicates the percentage of your new hires that came from a particular source or channel – e.g., job boards, referrals, direct approach, internal promotion, etc.
Knowing your best hiring sources will help you allocate your budget more effectively. For example, if you hired 10 people last month and half of them came through referrals, two through job boards, three through direct hire and none through the outside agency, you know which channel is efficient and which is not. This way you can direct more resources to the most valuable channels and drop those that do not bring candidates.
Recruitment status funnel
Recruiting is a process that resembles a sales funnel – it starts with sourcing candidates and ends with signing a contract. Many companies measure the effectiveness of the various steps in the funnel, which allows them to identify roadblocks and money wasters and optimize the entire process.
With people analytics, you can analyze each stage of the funnel and measure HR metrics and parameters such as:
Key HR metrics in organization and workforce management
List of organization and workforce HR metrics you get with Human Panel:
Headcount
Headcount change in time
Headcount by contract type
Leaders
Leadership ratio
Employee profiles
Billable vs non-billable employees
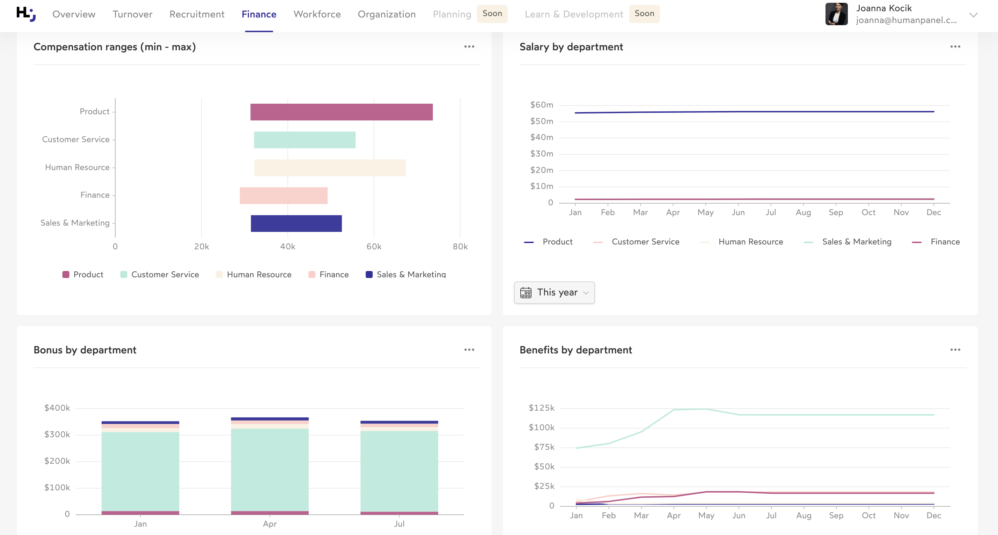
Compensation
Cost of benefits
Cost of bonuses
Organization structure
eNPS by team, department and project
Those indicators allow you to track:
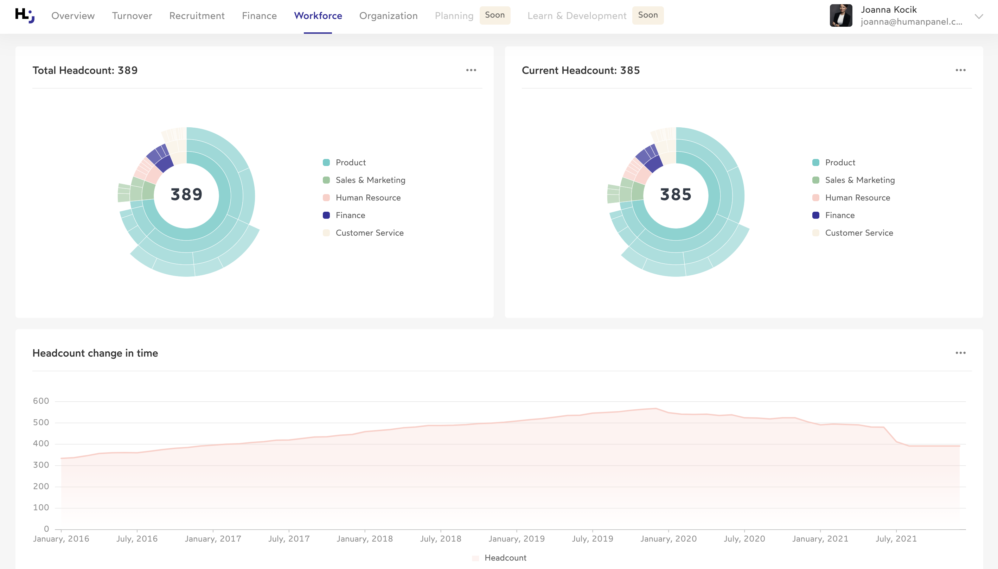
Headcount
The total number of employees in organization or within a specific department.
Knowing your headcount is fundamental for planning and talent management. It’s also useful to track headcount change in time and headcount by contract type and seniority. Note that tracking the number of full-time employees shows how many employees are embedded with the employer and gives you an overall impression of your ability to attract and retain a diverse workforce.
With Human Panel, you can track total headcount and current headcount. Current headcount does not include employees on long sick leaves, maternity leaves etc. You can also track the headcount change in time.
Leadership ratio
The number of leaders in relation to teams, departments, and employees.
Employee profiles
The characteristics of your workforce such as age, gender, education level, position, and tenure.
Apart from the basic demographics, employees profiles include such information as salary, employee NPs, performance level, organization level, absense, or overtime hours.
Billable vs non-billable employees
Billable hours represent the amount of time employees have spent on tasks that are invoiced to clients. Non-billable hours are the hours spent on tasks that don’t get invoiced. They are most often dedicated to different internal tasks.
Tracking all your employees’ time helps you see the full picture of how time is spent within your organization, especially if you work on projects for specific clients. It is crucial for analyzing the efficiency and profitability of projects and clients as well as of the entire company.
Planning your workforce budget can be a challenging task. With the right data, you can compare salaries across departments and roles, put them against market benchmarks and see how many employees are below or above salary band.
Cost per employee
Average monthly or yearly cost per employee that includes basic salary, employment taxes and benefits. It is typically in the 1.25 to 1.4 times base salary range.
The typical costs include:
recruiting expenses
basic salary
employment taxes
benefits
bonuses
office space
equipment
training
retirement benefits
A common practice is calculating employee hourly rate.
Cost of benefits per employee
Average monthly or yearly cost of benefits per employee. The benefits can include health benefits (insurance) as well as vacation time, meals, gym memberships, and paid leaves.
To correctly caclulate the cost of benefits per employee, you should also track the benefit participation rate, total benefits spend, and annual change in benefits spend. The range and cost of benefits depend strictly on the country legal system and obligations of the employer.
Cost of vacancies
The cost associated with having vacant positions, resulting from voluntary turnover and involuntary turnover.
The cost of vacancies can include various factors and there is no universal formula to calculate it. What you should take into consideration is the lost revenue or paying current employees overtime due to staff reduction. Note that filling the vacancy is often be more cost efficient than paying overtime.
Absence rate
The rate of unplanned absence due to sickness or other causes. The rate can be measured for an individual, team, or the company as a whole.
An absence rate of 1.5% is considered normal. A lower rate may indicate employees are afraid of taking unscheduled absences, preferring presenteeism that could indicate issues with company culture. A higher rate may indicate another range of issues impacting employee wellbeing.
Cost of absence
Cost of unscheduled leave and absences.
Cost of absence may include such factors as sick leave, cost of replacement staff, loss of production, quality loss, and the time managers spend on dealing with the absence.
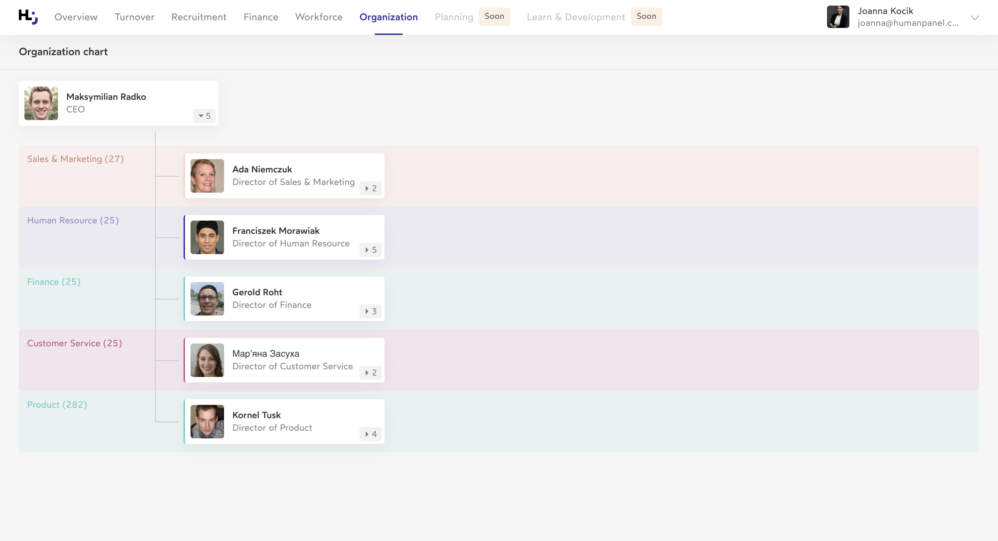
Organization structure
It is not a metric itself but can help you in visualizing the structure of your organization with all employees, leaders, teams, and departments.
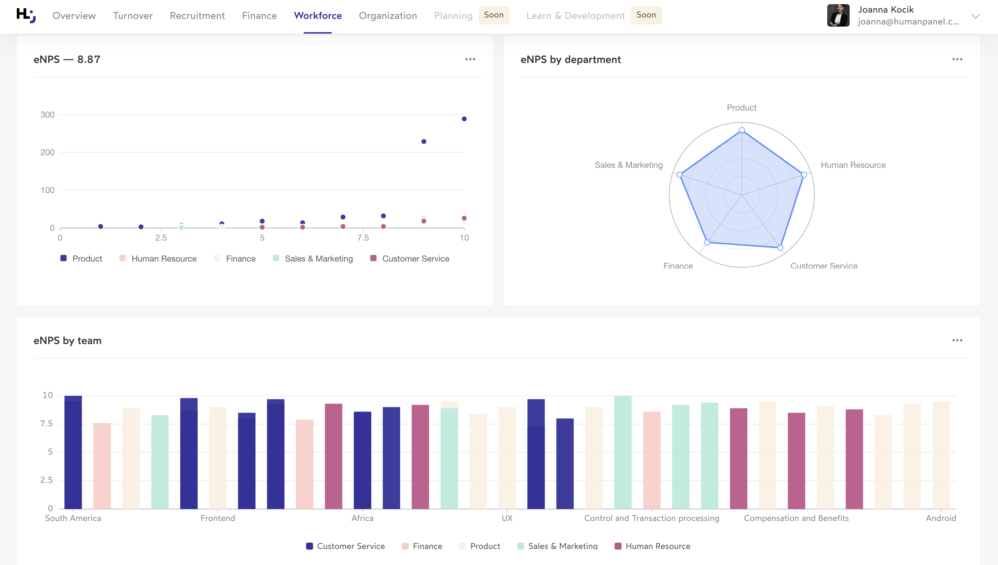
eNPs (Employee Net Promoter Score)
The number of employees who would recommend your company as a good place to work versus the number of employees who wouldn’t, indicating overall employees satisfaction.
This metric is considered one of the most efficient indicators of employee satisfaction. With Human Panel, you can track th eNPs by department, team, and project.
List of turnover & retention HR metrics you get with Human Panel:
Total turnover
Voluntary turnover
Early turnover
Turnover by leader
Regrettable and Non-regrettable leaves
Offboarding
Those indicators allow you to track:
Total turnover
The number of employees who leave your organization within a given period.
This metric is often shown as turnover rate, defined as the percentage of employees who left a company over a certain period of time. It usually includes voluntary resignations, dismissals, and retirements. It doesn’t include internal movements like promotions or transfers.
Voluntary turnover
The turnover rate including only those employees who leave your organization voluntarily.
Early turnover
The number of employees who leave the company in their first year on the job.
New hire turnover is nothing out of the ordinary – about 20% of employees leave within the first 45 days of employment. There are ways to reduce high employee turnover and identify the reasons for first-year turnover.
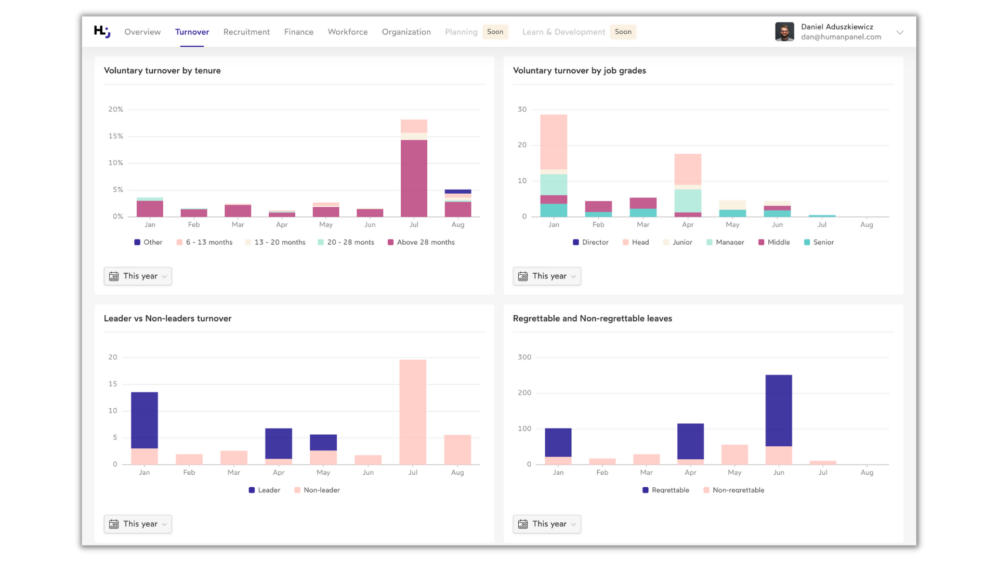
Turnover by leader
With Human Panel, you can track the turnover by leaders, departments, tenure, and job grades. It’s also possible to distinguish between leader vs non-leader turnover.
Regrettable and non-regrettable leaves
Regrettable turnover is when an employee’s departure from a company has a negative impact on the team or organization. Non-regrettable turnover means a departure that did not hurt the company.
Offboarding
Offboarding is the process that leads to the formal separation between an employee and a company through resignation, termination, or retirement.
To assess an employee’s score, their peers, subordinates, customers, and manager are asked to provide feedback on specific topics. This feedback often represents an accurate and multi-perspective view of an employee’s performance, skill level, and points of improvement.
Most companies conduct a 180-degree or 360-degree feedback evaluation, with detailed questions. Apart from assessing employee’s performance, employees assess their leaders, managers, and the company as a whole.
How many employees have access to coaching and mentoring?
People analytics – Summary
The above list of key HR metrics is not exhaustive. At Human Panel, we can design a customized solution according to the needs of your organization. Before you make any decision, we schedule free workshops for you and your team to discuss your challenges and prepare a custom solution.
Probably you’re wondering about the costs of implementing people analytics solution. They can positively surprise you – that we know. Sign up for our free demo to learn details and see how people analytics solution works in practice.